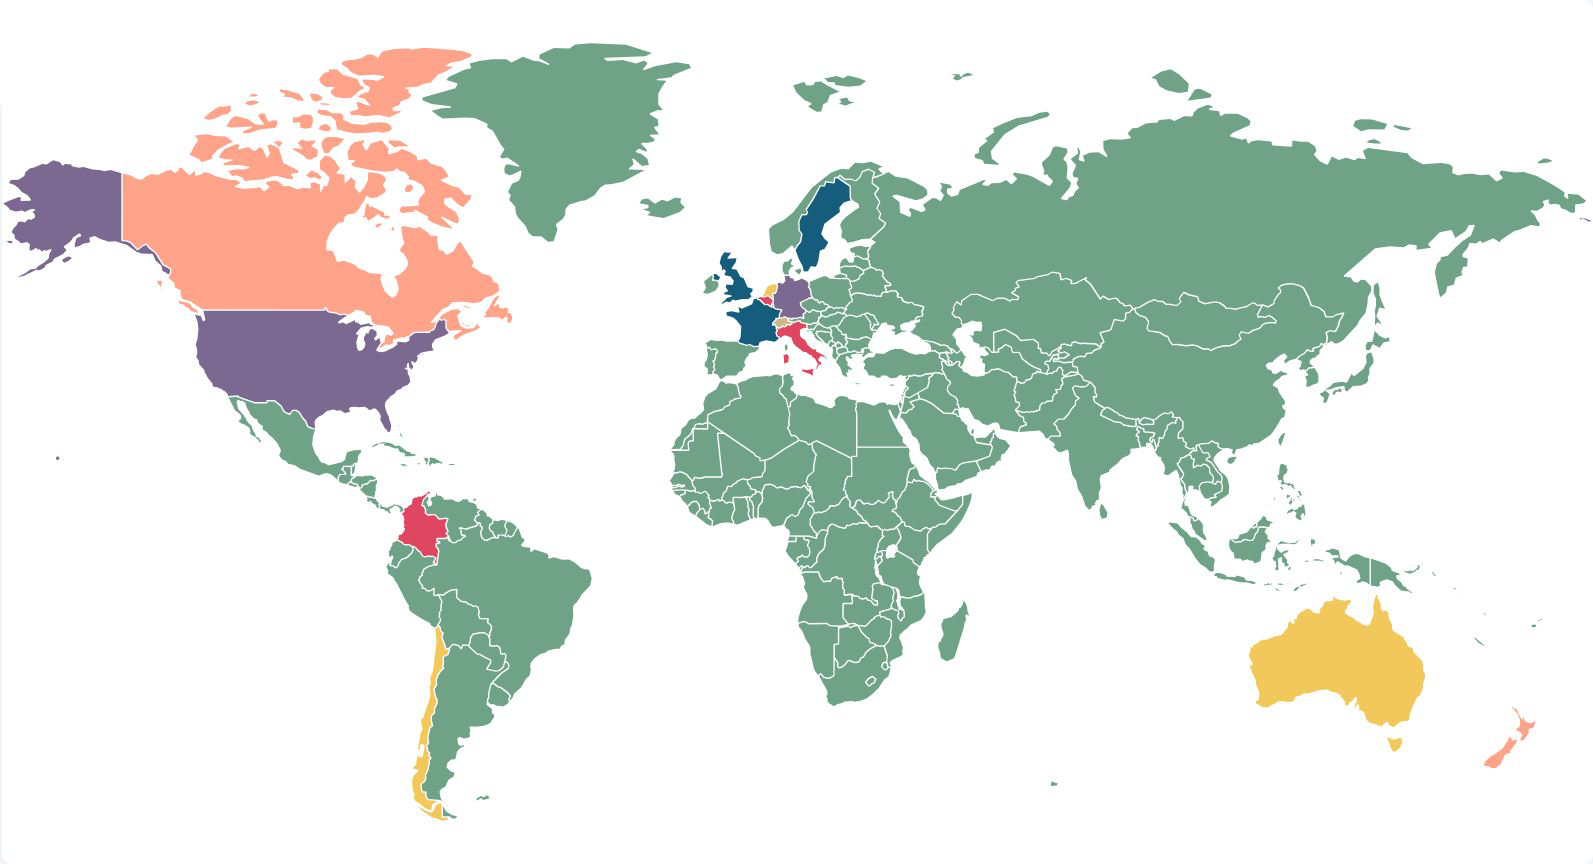
In this section, we provide our unique insights in a visual, often interactive, format.
Included in these resources are our ESG venn diagrams, which plot emerging risks and movement in industry focus; our interactive social inflation cross jurisdictional guide; and our climate change litigation map, highlighting our pick of the top 20 current cases around the globe.


